
A dynamic trading setup with two monitors. The main screen displays a "Bitcoin Dominance vs. Altcoin Index" chart, contrasting declining Bitcoin dominance (red line, 60% to 45%) with surging Altcoin performance (multi-colored lines, green "Altcoin Outperformance Zone"). Gauges to the right confirm "ALTSEASON CONFIRMED (75+)." The left screen shows a "Crypto X" social feed with headlines about capital rotation and DeFi jumps. A trader analyzes the data, coffee cup nearby.

What Is Altcoin Season? A Complete Guide

July 15, 2026 admin@basedmoondog.com 0

Wondering what altcoin season really means? This beginner-friendly guide explains how altcoin season works, how the Altcoin Season Index is calculated, why Bitcoin dominance matters, and what typically triggers capital to rotate into altcoins. Learn how experienced traders track market cycles, understand the risks, and assess whether conditions in 2026 could lead to the next altseason.

A concerned young man in a grey hoodie checks his smartphone displaying a crashing red Bitcoin chart on a busy, overcast city street.

What Is a Crypto Bear Market? A Complete Guide for Investors

July 9, 2026 admin@basedmoondog.com 0

A crypto bear market is a prolonged period of falling cryptocurrency prices, declining investor confidence, and increased market uncertainty. This beginner-friendly guide explains what causes bear markets, how they fit into the crypto market cycle, the risks involved, and practical strategies investors use to navigate prolonged downturns.

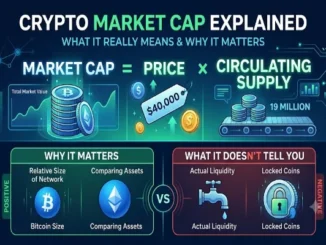
A detailed crypto-themed infographic in deep blues and electric greens. The top banner reads "CRYPTO MARKET CAP EXPLAINED" and "WHAT IT REALLY MEANS & WHY IT MATTERS." Below this, a large graphic formula shows "MARKET CAP = PRICE × CIRCULATING SUPPLY." Market Cap is represented by stacks of gold coins and a line graph labeled "Total Market Value." Price features a floating tag with "$40,000" and an upward arrow, with Bitcoin and dollar sign icons. Circulating Supply shows a conveyor belt moving stacks of coins and is labeled "19 MILLION" with a bar chart. The lower section compares two panels. The left panel, in green, is "WHY IT MATTERS" (POSITIVE) with points: 'Relative Size of Network' and 'Comparing Assets,' featuring large Bitcoin and Ethereum logo spheres labeled "Bitcoin Size" and "Comparing Assets." The right panel, in red, is "WHAT IT DOESN’T TELL YOU" (NEGATIVE) with points: 'Actual Liquidity' and 'Locked Coins,' represented by a leaky faucet labeled "Actual Liquidity" and a locked coin with a padlock labeled "Locked Coins." The panels are separated by a "VS" icon, with circuit board and connection details throughout the background.

Crypto Market Cap Explained: What It Really Means and Why It Matters

July 1, 2026 admin@basedmoondog.com 0

Crypto market cap is one of the most important metrics for evaluating cryptocurrencies, but it is often misunderstood. This beginner-friendly guide explains how market capitalization is calculated, why it matters more than price alone, how circulating supply and fully diluted valuation (FDV) affect a coin’s value, and the common mistakes investors should avoid when analyzing digital assets.